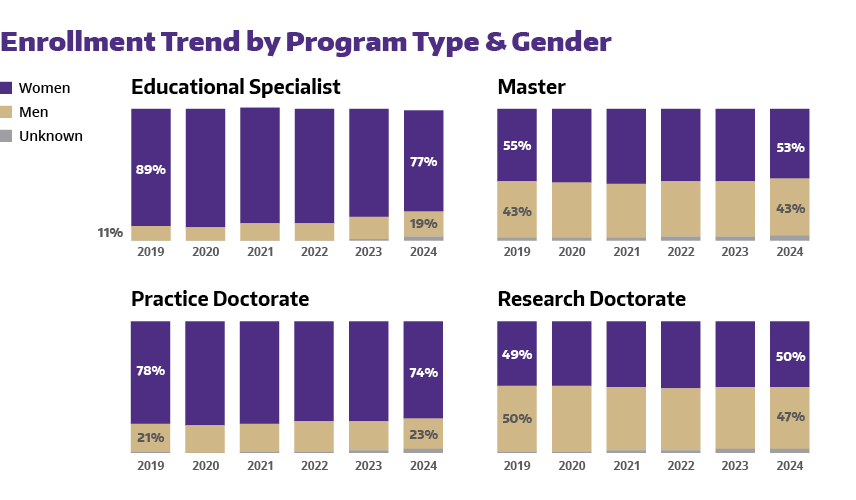
To give you an understanding of our graduate student demographics, here are a few snapshots of Autumn 2024 enrollment:
Summary
For Autumn 2024, we received 39,866 applications, which is 19% higher than the number received for Autumn 2019.
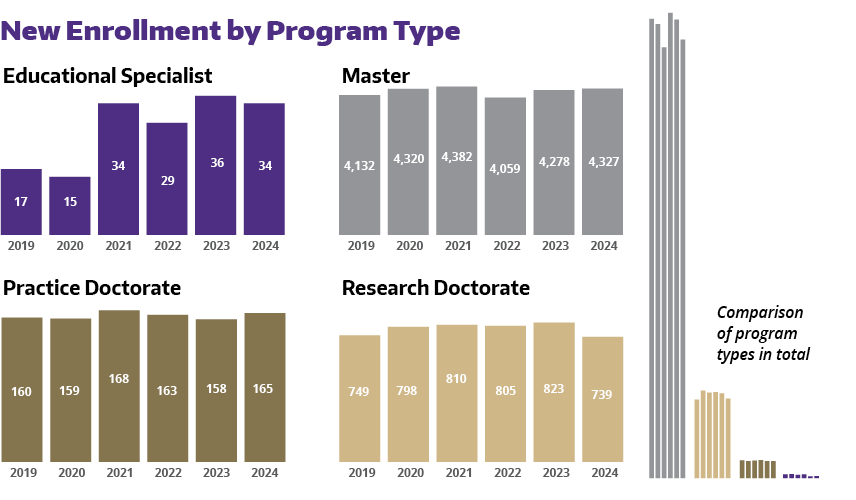
Overall new enrollment for Autumn 2024 is 5,260 students, which is a 4% increase from Autumn 2019. New enrollment in research doctoral programs has dipped 10% from Autumn 2023 and 1% from Autumn 2019. While educational specialists represent a small slice of graduate students at UW, entering cohorts have been growing and the new enrollment in Autumn 2024 is twice as large as in Autumn 2019.
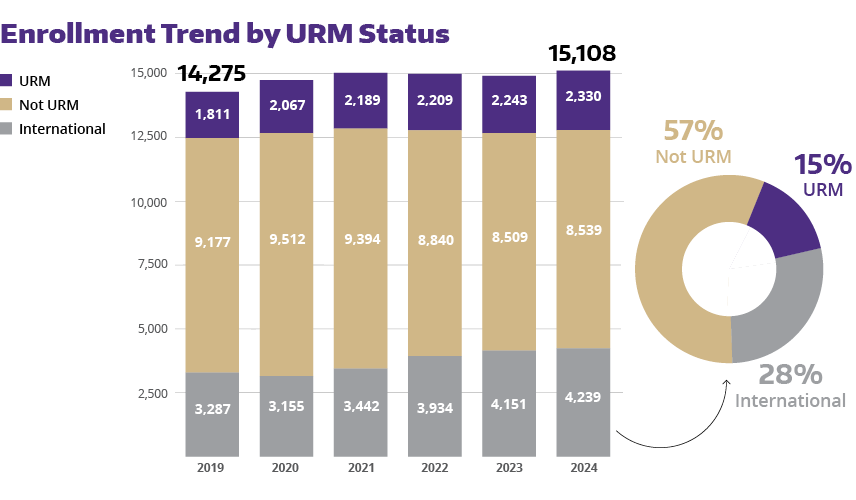
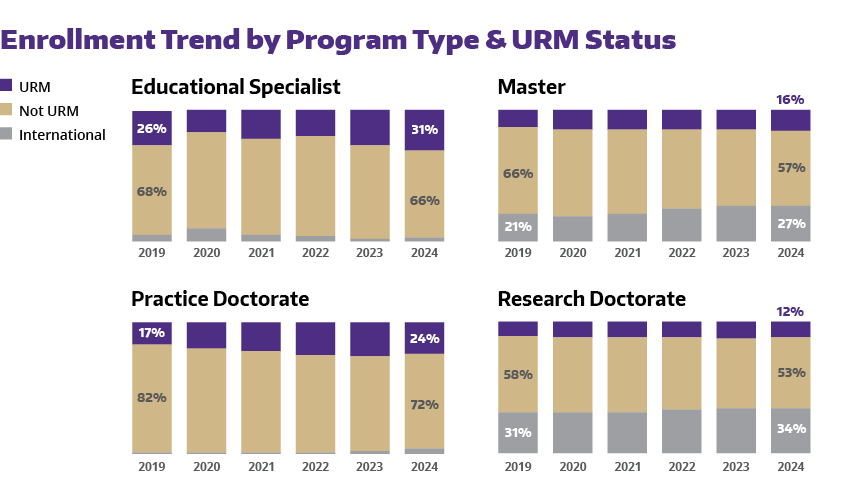
The race/ethnicity patterns in new enrollment this year are of particular interest since the June 2023 U.S. Supreme Court ruling to limit the use of race in admissions decisions. Compared to last year’s Autumn, we do not see a large change in the race/ethnicity breakdown for new enrollment.